
Six levels.Three charts.One view.
Support and resistance on the index and both option premiums at once: live, locked and on replay. For NSE and BSE F&O, on the web and Android.
For educational use. Levels are drawn from market data; no tips or signals. Not SEBI registered.
- NSE & BSE index F&O and F&O stocks
- Web and Android, one account
- Free trial on monthly AutoPay for new users
- Cancel AutoPay anytime from your Profile
- Never places orders or handles your funds
- For educational use · Not SEBI registered
Levels
Six levels, named. Live, then locked.
R1 and S1 mark moderate pressure, R2 and S2 risky pressure, and R-MAX and S-MAX extreme pressure. Each level is drawn live as a solid line and locks as a dashed line once its value repeats and holds. The band between the two is the zone.
Levels calculated with traditional technical methods.
| Level | Meaning | Live label | Lock label |
|---|---|---|---|
| R-MAX | Extreme pressure | L-R-MAX | K-R-MAX |
| R1 | Moderate resistance | L-R1 | K-R1 |
| R2 | Risky resistance | L-R2 | K-R2 |
| S2 | Risky support | L-S2 | K-S2 |
| S1 | Moderate support | L-S1 | K-S1 |
| S-MAX | Extreme pressure | L-S-MAX | K-S-MAX |
Replay
Replay any session. Watch the levels form.
Pick a past day and watch candles and levels build from 09:15 to 15:30, at 1x, 2x or 3x. It shows how a session unfolded, not what comes next.
Explore the AI Backtester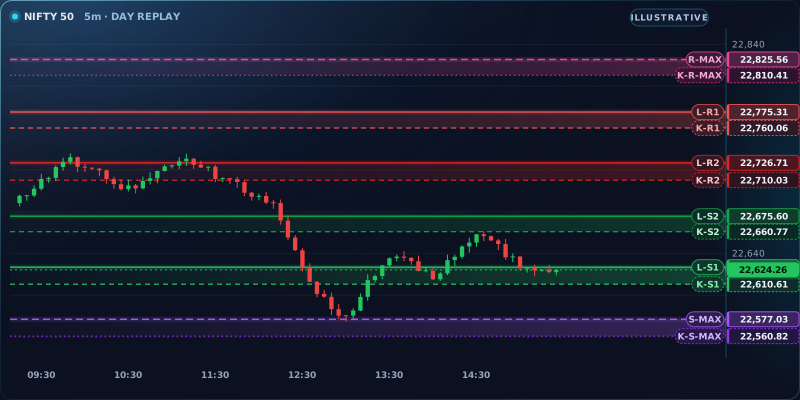
Past sessions do not predict future results.
Option chain
The chain, at a glance. Every strike, both sides.
Calls and puts around the at-the-money strike, with open-interest heat, the spot price and net totals.

ATM strike
The at-the-money strike is gold.
Spot price
A green pill on a lit divider sits between the two nearest strikes.
Heat
The largest OI, volume and OI change on each side are filled; runners-up are amber.
Net totals
Net volume, net OI and net OI change for calls and puts, and the OI change difference.
Around the chart
Around the chart. One tap away in the app.
Split view, market depth, the sector heatmap and the Learning Hub open from the same workspace.
All featuresAndroid
On Android, too. Same account. Same plan.
The app opens on the Market Hub and carries the AI chart, the option chain, market depth and tutorials.
App screens are illustrative.
Plans
Simple plans. Monthly with AutoPay, or pay once.
Cancel AutoPay anytime from your Profile. One-time plans never renew.
Create your account
Sign up with your mobile number or Google.
Choose a plan
Monthly with AutoPay, or pay once.
Open the AI chart
On the web or in the Android app.
AI tools
What’s inside. The AI tools and the engines behind them.
Each tool and engine as it appears in the app. The features page explains every one.
All featuresLoading…
FAQ
Questions, answered.
Still unsure? Contact us
What is TredexView?
TredexView is an AI-based market-data analysis and visualisation platform for Indian F&O. It draws live charts with six support and resistance levels, a Human Zone and an AI Zone, and adds option-chain intelligence, market depth, heatmaps and market news — on the web and in our Android app.
Is this investment advice or a tips service?
No. TredexView is a calculation and visualisation tool for educational and research purposes only. It does not give trading signals, buy/sell recommendations or investment advice, and it is not a SEBI-registered adviser or broker. Every decision you make is your own.
Which markets does it cover?
NSE and BSE index derivatives — NIFTY 50, BANK NIFTY, FIN NIFTY, MIDCAP NIFTY, SENSEX, BANKEX — plus F&O stocks.
Which devices can I use?
Any modern browser on a laptop, desktop or phone, and our Android app. Your account works on both.
Is there a free trial?
Yes — new users get a free trial on the monthly AutoPay plan. You see the exact trial length and the locked monthly price before you confirm, and if you cancel from your Profile before the trial ends, you are not charged.
How do AutoPay and cancelling work?
AutoPay renews the monthly plan at the same locked price through a UPI AutoPay or card mandate. You can cancel it anytime from your Profile, and no further charges are made. Prefer not to use AutoPay? Choose a one-time plan — it never renews automatically.
Does TredexView place trades for me?
No. TredexView never places orders and never handles your funds. It is an analysis and visualisation workspace — what you do in the market is entirely up to you.
What about refunds?
Refunds and cancellations are handled under our Refund & Cancellation Policy.
See every level. Decide for yourself.
TredexView is for educational and informational purposes only and is not a SEBI registered broker or advisory service.